


Google Analytics is a free online analytics service that provides basic analytical tools and statistics for marketing and search engine optimization (SEO). Google Analytics is used to monitor and analyse a website's performance as well as information about its visitors.
It can provide valuable information about the effectiveness of a company's marketing initiatives and campaigns, track how customers complete tasks (such as making purchases or adding items to their shopping carts), identify trends and patterns in customer behaviour, and gather demographic data, in addition to identifying the most popular sources of user activity.
In this article, we'll go over how to set up Google Analytics specifically for your store, the fundamental reports you should be checking, and a few extras to help you boost your knowledge and boost sales.
Why Google Analytics Is Important ?
Google Analytics is crucial for website owners and businesses. It provides essential insights about visitor behaviour, traffic sources, and conversion data. This information guides content and marketing strategies.
E-commerce tracking aids online retailers in monitoring product performance and sales. Its cost-effectiveness makes it accessible to businesses of all sizes. Google Analytics empowers informed decision-making, enhancing user experiences, increasing conversions, and optimizing online presence, ultimately contributing to business success.

You may use Google Analytics to better understand your visitors, the efficacy of your marketing campaigns, and how to best set up your business for conversions and sales.
How Does Google Analytics Work?
Google Analytics uses page tags to collect user data from every website visitor. JavaScript page tags are added to the code of each page. Google's data collection servers collect information from each visitor using this tag, which is incorporated in the visitor's browser.
Google Analytics may then generate customizable reports to monitor and display data on website traffic, average session lengths, sessions by route, page views, and more.
Google Analytics provides customers with the ability to track how visitors interact with their websites over time. Using features enables data collection, analytics, tracking, visualization, reporting, and interaction with other applications.
- Dashboards, scorecards, and activity charts that show data changes over time are examples of data visualization and monitoring tools.
- Filtration, modification, and analysis of data funnels.
- Data collection application program interfaces (APIs).
- Segmentation is used to analyse subsets of data, such as conversions.
- Reports designed specifically for advertising, audience acquisition, audience behavior, and conversion.
- Email allows for sharing and conversation.
- Google Ads, Salesforce Marketing Cloud, Google Data Studio, Google Optimize 360, Google AdSense, Google Optimize 360, Google Display & Video 360, Google Search Ads 360, Google Search Console, and Google Ad Manager are all integrated.
A unique collection of metrics for each website may be displayed in the Google Analytics dashboard, with the ability for users to save profiles for future use. Some of the categories that can be tracked are content summary, keywords, referral sites, visitor review, map overlay, and traffic streams overview.
What is a Google Analytics Metric?
A metric is a widely accepted quantitative measurement unit. Customers can use Google Analytics to track up to 200 variables to evaluate the performance of their websites. While some metrics may be more valuable to some businesses than others, the following are among the most commonly utilized metrics:
1. Users
A user is a one-time or unique visitor to a website.
2. The bounce rate
The percentage of visitors who only looked at one page. Each of these visitors sent only one request to the Google Analytics servers.
3. Meetings
This is a collection of visitor reactions over a 30-minute period of activity.
4. Average Session Length
The average amount of time spent on the site by each visitor.
5. New Session Percentage
The percentage of website visitors that are visiting for the first time.
6. Page Count Per Session
The number of times a page is seen in a single session.
7. Achievement of Goals
The frequency with which a visitor engages in a desired activity. This is also referred to as conversion.
8. Page views
The number of times a page has been accessed.
How to Set Up Google Analytics Ecommerce Tracking
Although setting up Google Analytics is very simple, the specifics will vary depending on your shopping cart. It's as easy as setting up a new Google Analytics account, copying the tracking code, and pasting it into the Google Analytics section on your settings page if you're using the typof platform.
How to Create a Google Account
You must have a Google account in order to use Google Analytics. You can use your existing Gmail account if you have one. Otherwise, register for a Google account.
- Open Google Analytics and click the top right-hand corner option labelled "Create an Account."
- Click on establish new account after logging into Google Analytics. This will create a new profile for you to monitor the metrics of your online store.
- Select Website on the following screen, then fill out the necessary information.
- To obtain your tracking code, click Get Tracking ID at the bottom of the page.
- You must copy the provided tracking code on the following page.
- Log into the typof admin and select "Settings."
- Into the area provided, paste the code you copied from Google Analytics.
- After the code has been added to your website, the last step is to activate Google Analytics' optional(though crucial) ecommerce tracking feature.
- In Google Analytics, select Admin from the menu bar at the top of any page.
- The drop-down menus can be used to choose your account.
- Click the toggle switch so it says ON in the Ecommerce Settings section by scrolling down.
- At the bottom of the page, click Save.
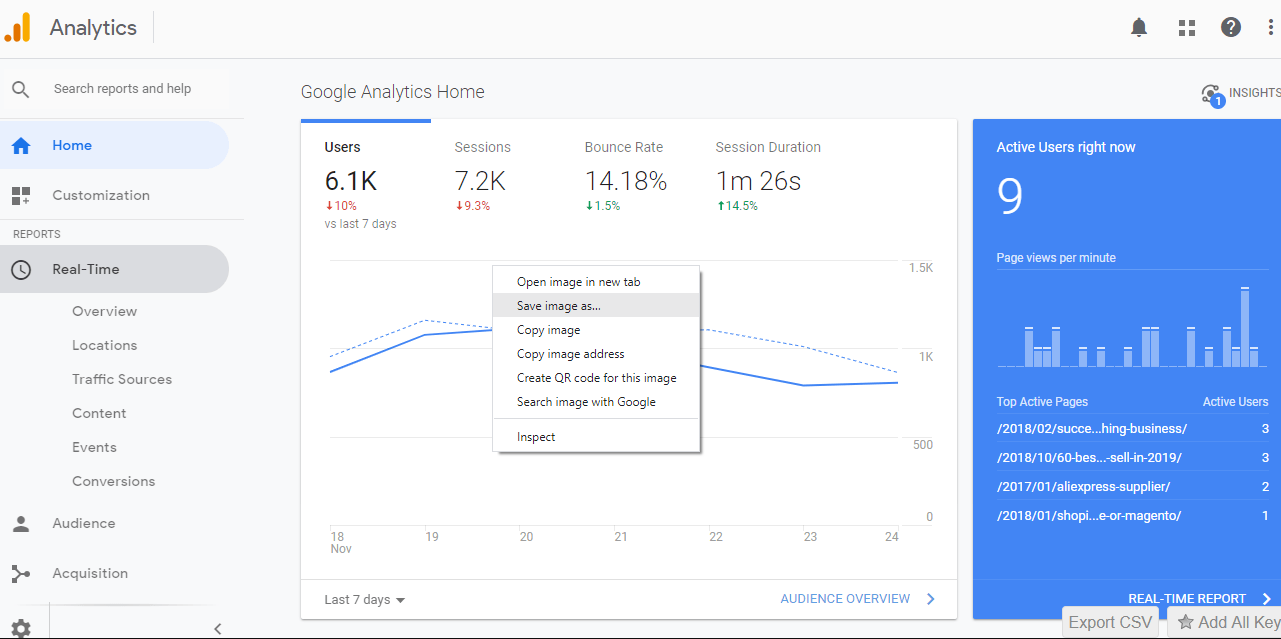
Simple Reports
Google produces a ton of data, and those reports may be customized in countless ways. The basic overview reports have plenty of helpful information and insights to get you started if you're just getting started.
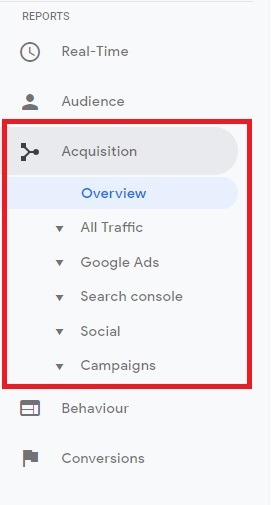
On the left side menu of Google Analytics, report category breakdowns are available. When you first begin, you should become familiar with the following sections:
- Real-Time -Displays current events on your website in real time.
- Acquisition -This information explains how visitors and consumers found and reached your website.
- Behaviour -Provides you with crucial details about your website and what users are doing there.
The most crucial and fundamental reports to know and comprehend if you're just starting off are highlighted below. Once you comprehend these reports, you should feel more at ease examining additional Google Analytics areas and reports.
1. Analytics Reports for Acquisition
Your Google Analytics acquisition reports can provide insights into how potential customers are finding your store, as we previously indicated.
This is one of the most crucial reports you have access to because it provides information on the traffic patterns to your store, the traffic channels that are effective, and the areas that want development.
Data on acquisition provides eCommerce business owners with important information about how customers are finding their stores. To develop a successful eCommerce marketing strategy, it is essential to determine which channels are bringing in the most visitors and sales.
Acquisition reports will also show which websites are linking to specific pages on your business. This will then enable you to locate any further potential traffic opportunities.
2. Reports on audience analytics
Google Analytics audience reports are the following insightful report that eCommerce business owners should be keeping an eye on. This area provides access to a wealth of traffic and customer information, including demographics, region, interests, technology, and many other factors.
You can quickly see the number of sessions (site visits) using Audience Overview, a pie chart of new returning users, and a variety of data, such as sessions, users, pageviews, pages per session, bounce rate, etc. Let's go over the data you may anticipate from each report section and how to apply this data.
Current Users:
You can monitor and track user interest levels with Active Users on a daily, weekly and monthly basis. This allows you to determine the kind of potential customers your traffic streams are bringing in at any one time.
Audiences:
To help you segment your market and generate tailored reports and funnels, you may upload developed audiences here and apply them to reports.
Behaviour:
Behaviour analytics will show you the number of new and repeat customers, how engaged they are while they are there, and how frequently they visit your store. With this knowledge, you can determine statistics like the proportion of customers who return to your store and the proportion of them who make purchases.
Benchmarking:
Comparative statistics Compare your observations with the data on the industry that Google has collected. This will enable you to evaluate targets and compare against niche competitors.
Custom:
While Defined Users enables you to look at groups of website users based on activity over certain date intervals, Custom reports allow you to apply custom variables to widen the reach of your segmentation.
Demographics:
This separates your visitors and customers by age and gender, enabling you to develop, test, and execute targeted advertisements for possible customer groups.
Interests:
Interest categories for affinity groups, in-market segments, and other audiences are indicated by analytics. You can use this information to direct your marketing efforts toward consumers who are more likely to buy what you're selling.
3. Reports on Behaviour Analytics
We'll examine behaviour analytics data as the following set of information. You may assess how focused your traffic is by using the behaviour overview to observe how long visitors stay on your store's website, how long they stay there, and which pages they read before departing.
Site Search is yet another crucial data source for your behavioural analytics. You can see in this report the proportion of visitors that utilized the site search feature as well as the search keywords they used. These terms can assist you in researching new search terms or adding potential products to your store based on the types of searches.
4. Reports from Conversion Analytics
Conversion analytics also contains data tailored to the eCommerce industry, which are crucial to the operation of online stores. They highlight the goods that your customers are purchasing as well as the volume of sales that top-selling goods are producing.
For each sale, they display transactional information such as tax, revenue, and shipping expenses as well as the number of sessions (website visits) necessary for a customer to complete a transaction.
5. Reports from Real-Time Analytics
You can get real-time analytics in this section, including information on location, sources, content, events, and conversions.
ECommerce Analytics Requirements by Stage of Business
Different analytics tools will be more important than others to help design tactics at various phases of your eCommerce journey. An eCommerce firm goes through four of these stages:
Stage 1: Before Launch
You are getting ready to open your new internet store from this location. Validating your store, organizing your marketing, dotting all the i's on your fulfilment plans, and fine-tuning your designs are some of the duties you'll have to complete.
Many beginners are unaware of the important impact Google Analytics may play at this point in assisting you in determining any product or store interest throughout your pre-launch build up marketing.
These include information about the number of visitors who are accessing your store URL through your 'coming soon' advertisements and posts. If your traffic doesn't change, it can indicate that your targeting or product aren't ready for launch.
Stage 2: Start
Your live eCommerce site's initial weeks are known as the launch phase. You likely have website traffic at this point, but there haven't been any sizable sales. You can compare launch and pre-launch traffic and data using Analytics at the launch stage.
Additionally, you can make sure the traffic you are directing is relevant. The longer time a customer spends on your store and the more pages they visit, the more likely it is that they will be interested in what you have to offer. You can tell this by looking at bounce and session rates.
The most popular products and landing pages are a few of other Analytics indicators to keep an eye on right now. You can determine where your sales funnel and page CTAs should be if traffic is arriving but not moving forward.
Stage 3: Initiation of Growth
You'll want to go more deeply into your analytics after you start producing a consistent volume of sales each week. By doing this, you may make sure that you're receiving sophisticated eCommerce-specific data, such as transactional data.
At this point, you should be looking for indicators that your marketing methods are effective, seeing which goods are performing better than others, identifying the top-spending customer categories, and reviewing highly segmented audience reporting that you can utilize for marketing and product development.
Here, the most important analytics to follow are:
- Top-selling goods
- Total income
- Transactions Made average Order Value
Stage 4: Continued Growth
Planning your long-term initiatives for dependable long-term growth should begin after you have a mortem. Utilize analytics to help you establish dependable marketing channels and identify ways to scale your company from 12 sales per week to 1,000. By examining your product views, add to basket, checkout, and transaction sessions, you may determine which pages your store visitors are leaving.
The performance of the marketing channels, the products driving the most sales, and parts of your website's user experience and marketing plan that you could improve to boost sales are some more crucial analytics data points.
FAQ


